Crypto's Power Move: Unlocking the Secrets of the Ascending Triangle!
ILiasse Baiod
6/5/20256 min read
Introduction to the Ascending Triangle Pattern
The ascending triangle pattern is a prominent formation in technical analysis, particularly in the context of cryptocurrency trading. This pattern typically emerges during bullish trends and is characterized by a horizontal resistance level and an upward sloping trendline. By connecting the higher lows, traders can visualize the growing buying interest while the price is unable to breach the established resistance. The resulting shape of this pattern resembles a triangle, hence its designation.
In the realm of cryptocurrency, where volatility and rapid price movements are commonplace, identifying the ascending triangle pattern can be pivotal for traders seeking to capitalize on potential upward price shifts. The importance of this pattern lies in its ability to signal future directional moves. When a trading terminal displays this formation, it suggests that the asset’s price may soon break through resistance, leading to a notable price increase. As traders navigate through the crypto market, recognizing such significant patterns can enhance their decision-making process regarding entry and exit points.
What is an Ascending Triangle Pattern?
The ascending triangle pattern is a prominent technical analysis formation in the realm of crypto trading, recognized for its distinctive shape and implications for price movement. This pattern characteristically consists of two main lines: a horizontal resistance line at the top and a rising support line at the bottom. The horizontal resistance indicates a price level where selling pressure meets strong demand, preventing prices from rising above that threshold. Meanwhile, the ascending support line reflects a gradual increase in demand, showcasing buyers’ willingness to enter the market at progressively higher price points.
The formation of an ascending triangle usually occurs during an uptrend or at a price consolidation phase, indicating that buyers are increasingly confident and sellers are losing their dominance. As the pattern develops over time, it indicates a tightening range where the price oscillates between the rising support and the constant resistance. Traders often interpret this pattern as a bullish signal, as the pressure builds from below tends to eventually breakout past the resistance line.
Moreover, it is crucial to differentiate between bullish and bearish contexts in which ascending triangles may arise. In a bullish ascending triangle, the expectation is for an imminent breakout above the horizontal line, leading to a subsequent rise in price. Conversely, should an ascending triangle form during a broader bearish market, it might indicate a potential reversal or a temporary retracement before the prevailing downtrend resumes. Understanding the broader market context surrounding this pattern is essential for traders seeking to maximize their trading opportunities and mitigate risks.
Identifying the Ascending Triangle Pattern
The ascending triangle pattern is a significant chart formation widely recognized in the landscape of crypto trading. To identify this pattern on price charts, traders should first look for its distinct characteristics. Typically, the ascending triangle features a horizontal resistance line at the upper boundary, while the lower boundary inclination shows a series of higher lows. This combination indicates that buyers are gradually gaining strength, setting up for a potential breakout.
Volume plays a crucial role when identifying the ascending triangle. Traders should observe an increase in trading volume as the pattern develops. An increase in volume often precedes the breakout, affirming that strong market interest is supporting the emerging trend. If the volume remains muted, it may signal indecision and potentially lead to a failure of the breakout scenario.
Price behavior leading up to the formation is another essential factor. Look for several test touches at the top horizontal resistance line, which signifies that sellers are struggling to push the price lower, while the consistent higher lows on the lower boundary point toward the buyers' commitment. This convergence is indicative of a tightening market, producing a potential breakout point, ideally confirmed by a surge in volume.
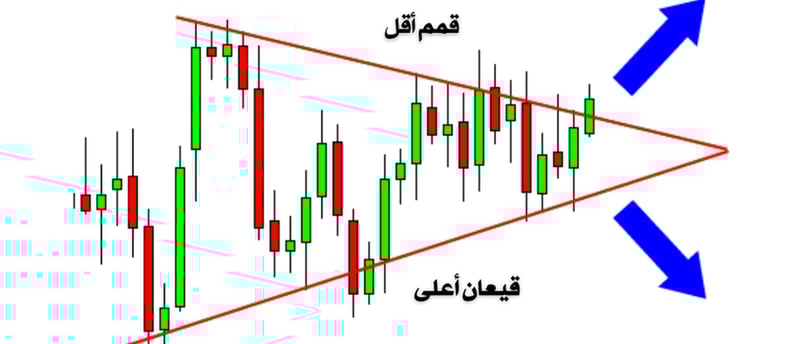
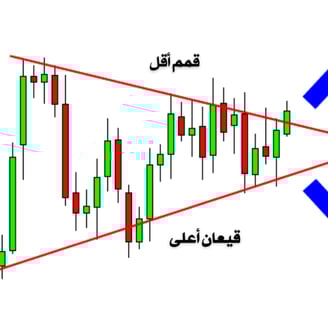
Visual examples can significantly aid traders in recognizing the ascending triangle pattern in real-time scenarios. Charts illustrating the pattern, along with annotations highlighting the key characteristics—such as the parallel resistance line and rising trendline—enhance the understanding of the structure. Additionally, different timeframes may present varying success rates, with shorter timeframes often reflecting rapid market movements, while longer durations provide a clearer picture of the pattern's validity.
Incorporating these practical tips into your trading strategy will facilitate the effective identification of the ascending triangle, ultimately aiding in making informed trading decisions.
Significance of the Ascending Triangle Pattern in Crypto Trading
The ascending triangle pattern is a highly significant formation in the realm of crypto trading, as it often indicates potential bullish momentum. Traders are drawn to this pattern for various reasons, one of which lies in its clear visual representation of market dynamics between buyers and sellers. An ascending triangle typically forms when a series of higher lows appears, with a horizontal resistance level demonstrating that sellers are unwilling to push the price higher. This scenario typically suggests increasing buying pressure, indicating that traders could soon see a breakout.
Understanding the psychological underpinnings of the ascending triangle pattern is crucial for successful trading strategy development. As the formation develops, market participants can become increasingly optimistic, leading to heightened levels of buying activity as traders anticipate a breakout. These expectations can often create a self-fulfilling prophecy, where the actions of traders legitimize the earlier suspicion that a breakout is imminent, leading to even more aggressive purchasing behavior. Conversely, sellers—observing the pattern—may also recognize the potential weakness of their position, contributing to a reinforce momentum towards the upside.
Moreover, the ascending triangle pattern offers traders the opportunity to establish a favorable risk-to-reward ratio. In many instances, once a breakout occurs from this pattern, the subsequent price movement can yield substantial rewards in relation to the initial risk taken. This is particularly appealing in the highly volatile cryptocurrency markets, where traders often seek to capitalize on rapid price changes. Identify the ascending triangle during chart analysis can signal to traders that they are positioned for potential gains, while also enabling them to employ effective risk management tactics in their trading plans.
Trading Strategies Involving the Ascending Triangle
The ascending triangle pattern is widely recognized among traders as a bullish continuation pattern. By strategically leveraging this formation, traders can implement a series of effective strategies to optimize their trading outcomes. One key approach entails identifying entry points that coincide with the breakout from the triangle’s upper resistance line. Generally, traders may place a buy order just above this resistance level to capture potential upward momentum, ideally signaling a trend continuation. It is crucial, however, to ensure that the breakout is supported by increased volume, as this adds validity to the signal.
Moreover, determining exit points is essential for maintaining risk-reward ratios consistent with one’s trading strategy. Traders typically utilize specific targets based on the height of the triangle, projecting these targets from the breakout point. For example, if the triangle pattern has a height of 10%, the trader might anticipate a similar movement post-breakout, thus setting a target price that reflects this potential gain.
Alongside entry and exit strategies, stop-loss placements play a critical role in managing risk. A commonly favored strategy involves placing stop-loss orders just below the triangle's lower support line. This provides a predefined risk level, which is essential in volatile markets such as cryptocurrency trading. Additionally, risk management techniques can further reinforce trading decisions. Position sizing, for instance, should align with the trader’s overall risk appetite, ensuring that no single trade disproportionately affects the trading account.
Incorporating real-world examples can further illustrate the effectiveness of these strategies. A trader who identifies an ascending triangle formation on a prominent cryptocurrency, such as Bitcoin, may apply these strategies to capitalize on breakout opportunities and increase their profitability while mitigating risks associated with sudden market fluctuations. The disciplined application of these techniques fosters a more systematic approach, inherently benefiting traders who seek to navigate the complexities of the crypto market.
Common Mistakes to Avoid When Trading the Ascending Triangle
The ascending triangle pattern is a bullish formation that can signal a potential upward price movement in the crypto market. However, many traders fall victim to a variety of common mistakes that can hinder their success when trading this pattern. Being aware of these pitfalls can help traders refine their strategies and enhance their overall efficiency in the market.
One frequent mistake is misinterpreting the ascending triangle itself. Traders may confuse this pattern with other chart formations, such as flags or wedges, leading to erroneous trading decisions. To avoid this, it is crucial to understand that the ascending triangle is characterized by a series of higher lows and a flat upper resistance line. Misidentifying this pattern can result in entering or exiting trades at inopportune times.
Additionally, ignoring volume signals can be detrimental. Volume plays an essential role in confirming the strength of a breakout from an ascending triangle. If traders do not consider volume trends during this formation, they may prematurely enter or exit trades, potentially missing significant market movements. In a valid breakout, an increase in volume typically coincides with price action, confirming the pattern’s reliability.
Insufficient risk management represents another serious oversight. Traders often underestimate the importance of setting stop-loss orders or position sizing when engaging with the ascending triangle pattern. Without proper risk management strategies, traders may expose themselves to greater losses than they can afford if the market moves against their position. It is essential to establish a well-defined risk-reward ratio and adhere to it throughout the trading process.
By recognizing these common mistakes, traders can better navigate the complexities of the ascending triangle pattern and improve their success in the dynamic cryptocurrency market.
afrahin20@gmail.com
+212609840528
All rights reserved © 2025